Introduction: Microsoft Fabric vs Power BI – What Beginners Need to Know
If you’ve been exploring data tools from Microsoft, you’ve likely come across Microsoft Fabric and Power BI. But what exactly is the difference between the two? Are they competitors or collaborators?
Let’s break it down in simple terms so you can understand their roles—and how they complement each other in modern analytics solutions.
What is Microsoft Fabric?
Microsoft Fabric is an end-to-end data platform introduced by Microsoft in 2023. Think of it as an all-in-one solution that unifies multiple data services—like data integration, data engineering, data science, and real-time analytics—in a single platform.
Fabric is built on top of Microsoft OneLake, a central data lake, and includes features such as:
-
- Data Factory for data ingestion
- Synapse Data Engineering for processing
- Power BI for reporting and visualization
- Data Activator for real-time monitoring
What is Power BI?
Power BI is Microsoft’s popular business intelligence and data visualization tool. It allows users to connect to data, create interactive dashboards, and generate insights in a user-friendly, no-code environment.
Power BI:
-
- Helps you make data-driven decisions
- Integrates seamlessly with Excel, Azure, and now Microsoft Fabric
- Offers Power BI Desktop, Power BI Service, and Power BI Mobile
How Microsoft Fabric and Power BI Work Together?
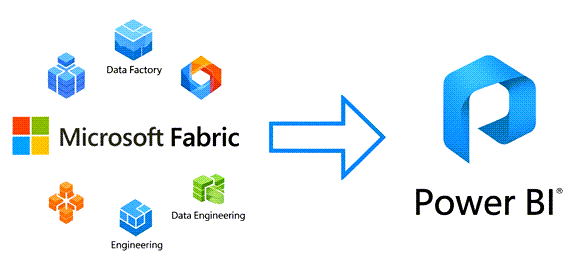
Here’s where the connection happens: Power BI is a core component of Microsoft Fabric.
Think of Microsoft Fabric as the engine, and Power BI as the dashboard you use to visualize what’s happening inside.
| Feature | Microsoft Fabric | Power BI |
|---|---|---|
| Purpose | Full-stack data platform | Business intelligence and reporting |
| Scope | Covers data ingestion to visualization | Focused on data reporting and insights |
| Components | Data Factory, Synapse, Power BI, OneLake | Power BI Desktop, Power BI Service |
| Best For | Data engineers, scientists, architects | Analysts, business users |
| Integration | Includes Power BI natively | Can operate standalone or within Fabric |
Why Choose Fabric or Power BI—or Both?
-
- If you’re just looking to visualize data from Excel or SQL—Power BI alone may be enough.
- If you need to manage the entire data lifecycle—from ingesting, storing, transforming, to analyzing—Microsoft Fabric is your go-to.
- For businesses scaling their analytics strategy, using both together offers maximum power and flexibility.
Audience-Specific Steps:
For Data Engineers: Focus on setting up robust data pipelines in Fabric’s Data Factory, managing data lake storage in OneLake, and optimizing Spark jobs within Data Engineering. Pay close attention to data quality and schema enforcement.
For Data Scientists: Leverage Fabric’s Data Science workload to build, train, and deploy machine learning models, enriching the data in OneLake with predictions that Power BI can then visualize.
For Business Analysts (Power BI Users): Concentrate on connecting Power BI to the curated data in Fabric’s Lakehouse or Data Warehouse. Master Power BI’s data modeling capabilities (DAX, relationships) and design compelling dashboards that tell a story. Utilize the new Microsoft Fabric vs Power BI integration to your advantage, especially Direct Lake mode for faster insights.
Pro Tips:
Embrace OneLake: Fabric’s OneLake is a game-changer. It creates a single, logical data lake for your entire organization, minimizing data duplication and movement.
Direct Lake Mode: For Power BI reports built on large datasets within Fabric, use Direct Lake mode. This allows Power BI to query data directly from OneLake without loading it into memory, significantly improving performance.
Capacity-Based Pricing:
Understand that Microsoft Fabric utilizes a capacity-based pricing model, where you pay for compute resources shared across all Fabric workloads. Power BI Pro/Premium licenses might still be required for sharing content depending on your Fabric capacity SKU.
Leverage Copilot in Fabric: Explore Copilot’s AI-powered capabilities within Fabric to accelerate data transformation, generate insights, and even assist in creating Power BI reports.
Further Reading:
Microsoft Fabric Official Documentation (Internal Link)
Power BI Documentation (Internal Link)
Understanding Microsoft Fabric Pricing (Outbound Link)
Common Questions Answered (FAQs)
1. Is Power BI being replaced by Microsoft Fabric?
No, Power BI is not being replaced. It’s now part of Microsoft Fabric, making it even more powerful within a complete analytics ecosystem.
2. Can I still use Power BI separately?
Yes. Power BI still works as a standalone tool. But when used within Fabric, you unlock access to a much broader data platform.
3. Is Microsoft Fabric free?
Microsoft Fabric comes with a licensing model, but Power BI Pro and Premium can still be used independently. Fabric trials are available via Microsoft.
4. Who should use Microsoft Fabric?
Data professionals and businesses looking for a centralized, scalable, cloud-first data solution.
5. Is it hard to learn Microsoft Fabric if I already use Power BI?
Not at all. Power BI skills give you a strong foundation to explore the extended capabilities of Fabric.
query@smartmilestones.com
Contact us for more tips and consulting support!
